
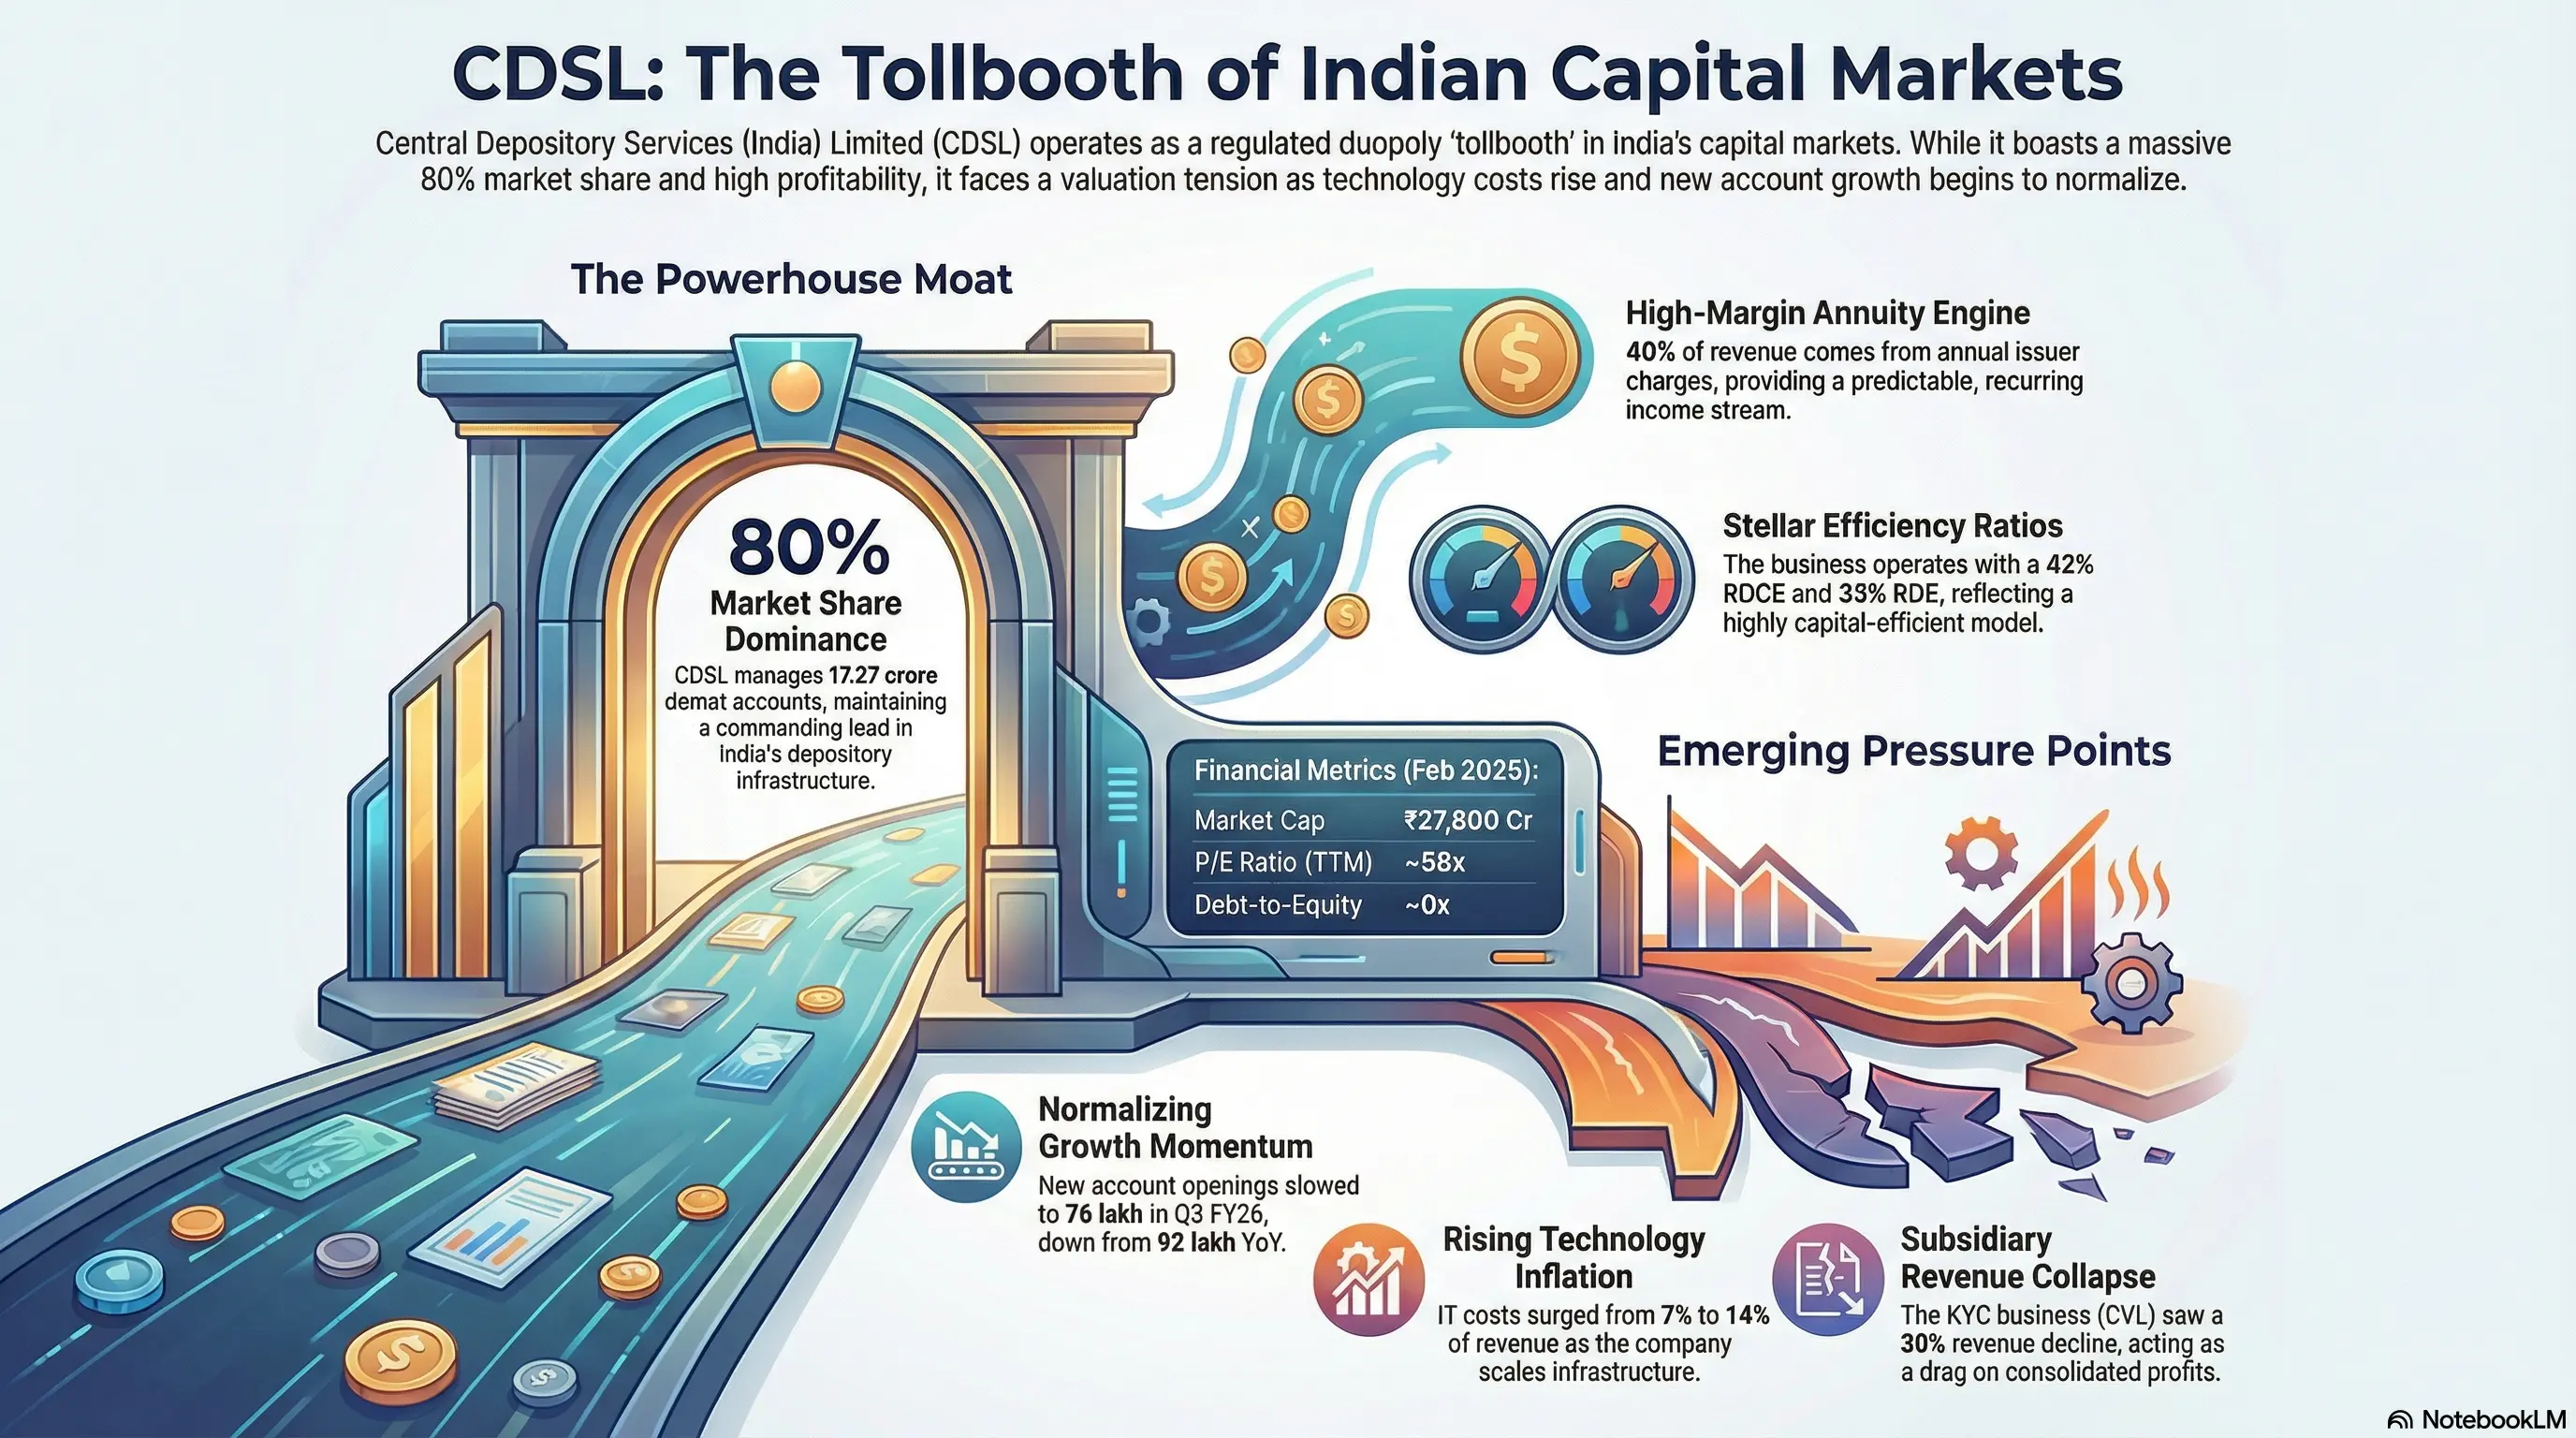
THE TOLLBOOTH YOU CAN’T AVOID
Every time an Indian investor opens a demat account, buys an IPO allotment, pledges shares for margin, or receives a corporate dividend — somewhere in the background, a depository clips a tiny fee. It’s not glamorous. There’s no factory, no inventory, no raw material cycle. But it’s one of the purest toll-collection businesses in Indian capital markets. And eight times out of ten, that toll goes to CDSL.
WHAT CDSL ACTUALLY IS (AND WHY IT’S HARD TO COPY)
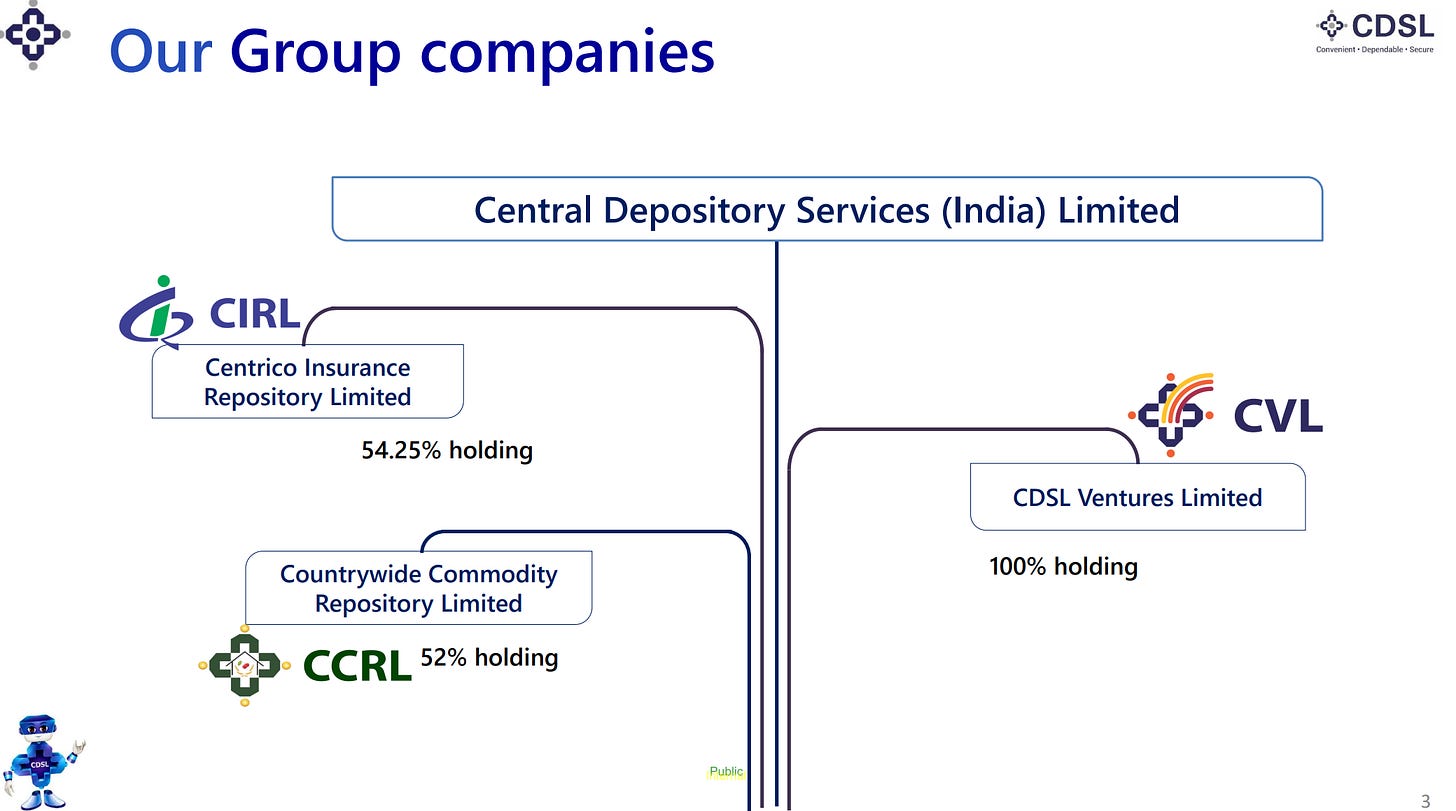
Central Depository Services (India) Limited was incorporated in 1997 and commenced operations in 1999, headquartered in Mumbai. It is one of only two securities depositories in India (the other being NSDL), operating as a SEBI-regulated Market Infrastructure Institution (MII). CDSL holds securities in dematerialised form and facilitates settlement of trades executed on stock exchanges. Its services span demat account management, e-voting, electronic consolidated account statements (eCAS), margin pledge, IPO processing, and corporate actions. The company operates through three subsidiaries: CDSL Ventures Limited (CVL) — India’s largest KYC Registration Agency with 9.95 crore records; Centrico Insurance Repository (CIRL) — an IRDAI-registered insurance repository holding 20+ lakh policies; and Countrywide Commodity Repository (CCRL) — which facilitates electronic commodity warehouse receipts under WDRA. The moat is structural: India legally requires only two depositories, SEBI controls licensing, and switching costs for the 700+ depository participants are enormous. You don’t compete with CDSL — you either use it, or you use the other one.
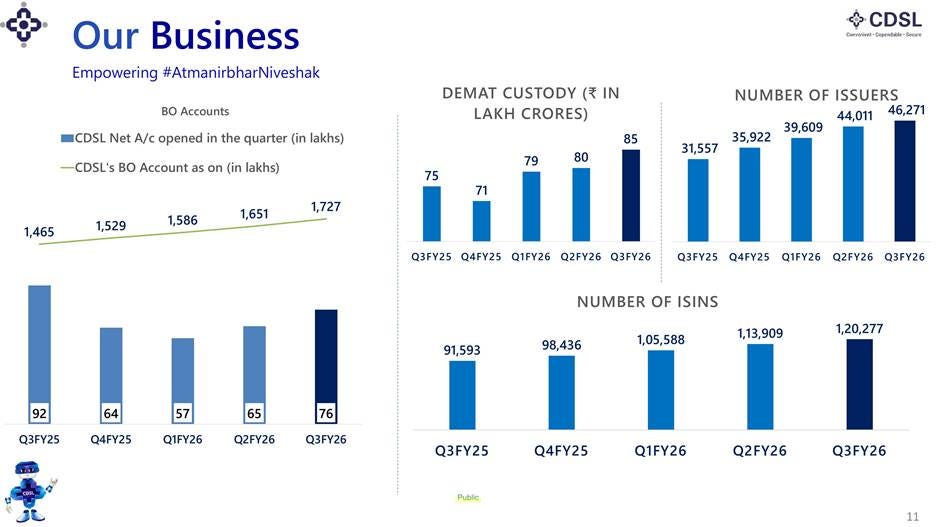
Source: CDSL Investor Presentation — Q3 FY26 | BO Accounts: 17.27 Cr, Demat Custody: ₹85L Cr, Issuers: 46,271, ISINs: 1.2L+
THE NUMBERS THAT MATTER
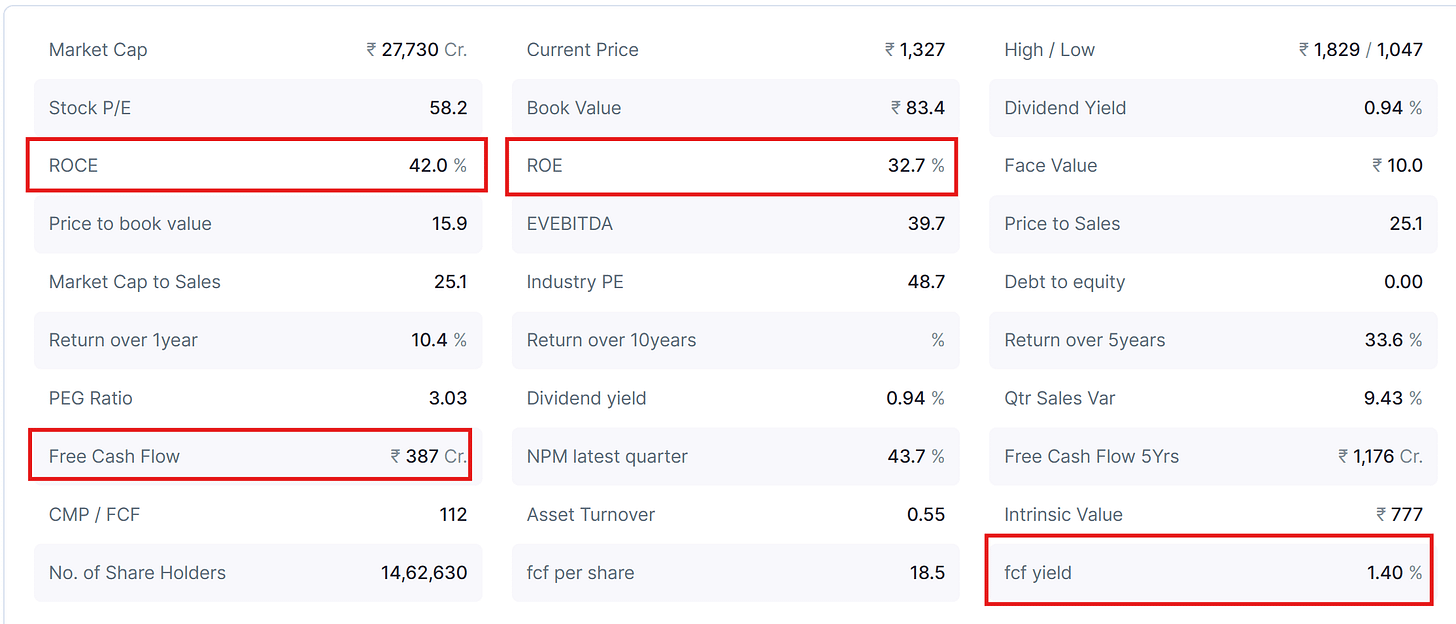
Data as of February 2026. CMP sourced from NSE. Consolidated financials from Screener.in.
80% MARKET SHARE. DUOPOLY MOAT. AND STILL ADDING 75+ LAKH ACCOUNTS A QUARTER.
The core thesis on CDSL is deceptively simple: India’s capital market participation is still in the early innings, CDSL commands a dominant and growing share of the depository infrastructure, and every incremental investor who enters the market generates recurring revenue across multiple touchpoints — annual issuer charges, transaction fees, KYC registration, margin pledge, eCAS, and e-voting.
The numbers tell the story. CDSL’s total beneficial owner (BO) accounts reached 17.27 crore as of December 2025, up from 14.65 crore a year ago. The depository industry has crossed 21.6 crore accounts, and CDSL maintains an 80% share of the total base. Demat custody value stands at ₹85 lakh crore, number of issuers has grown to 46,271 (up 47% YoY), and ISINs have crossed 1.2 lakh. The annuity-like nature of issuer charges — which grew from ₹81 Cr in Q3 FY25 to ₹113 Cr in Q3 FY26 (+40% YoY) — is the bedrock of CDSL’s revenue durability.
What changed structurally over the past three years was the explosion in retail participation post-COVID. From 3 crore demat accounts in 2020, the industry has 7x’d to 21.6 crore. CDSL captured the lion’s share, powered by its technology stack, lower pricing (₹0.50 cheaper per transaction than NSDL), and deep integration with fintech brokers like Zerodha and Groww. Nehal Vora, MD & CEO, framed it on the concall: CDSL is building infrastructure “like a road — how much the road is used depends on traffic, but the road provider has to ensure the value proposition remains seamless.”
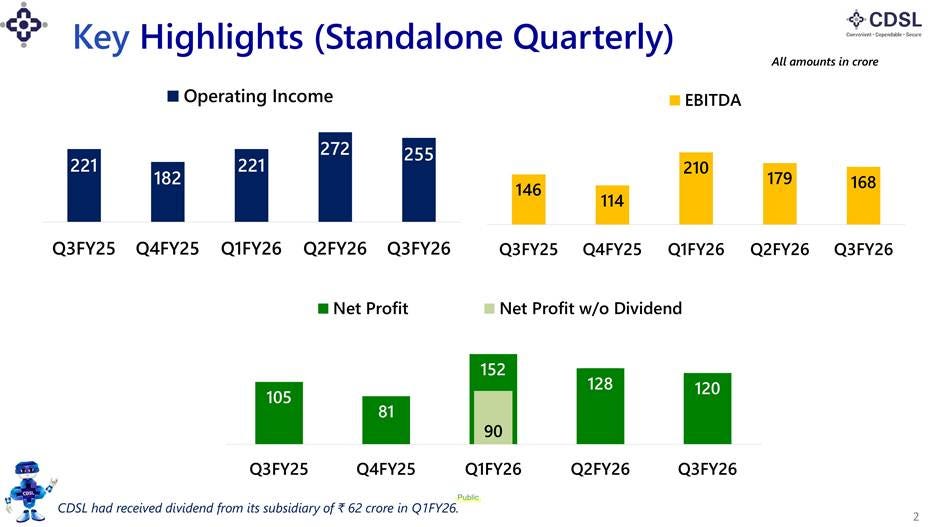
Source: CDSL Investor Presentation — Standalone Quarterly: Operating Income ₹255 Cr, EBITDA ₹168 Cr, Net Profit ₹120 Cr in Q3 FY26
REVENUE SEGMENTS: WHERE THE MONEY COMES FROM
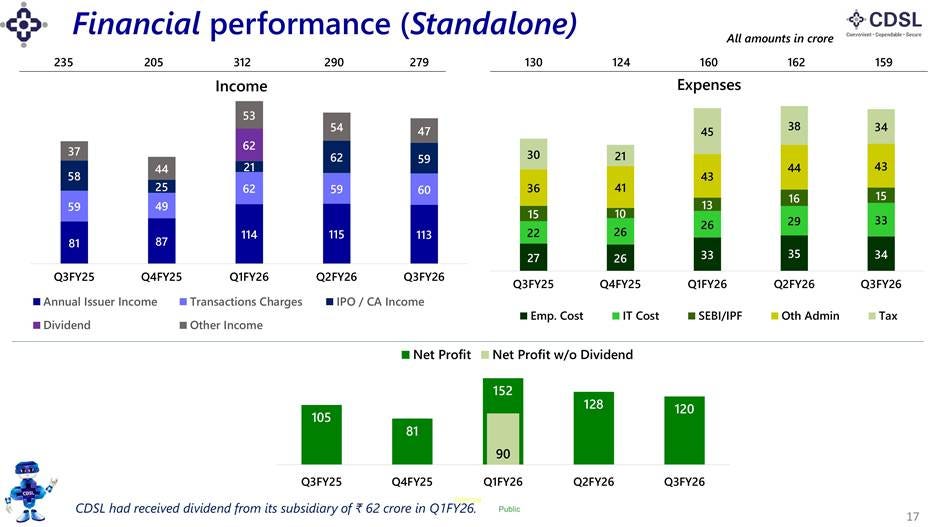
CDSL’s standalone revenue is diversified across several streams, each linked to different drivers of capital market activity. In Q3 FY26 (standalone), total income was ₹279 Cr (vs ₹235 Cr YoY). Here’s how it breaks down:
📌 Annual Issuer Income (₹113 Cr, 40% of operating income): This is the annuity engine. Every company with securities in demat form pays CDSL an annual charge based on the number of folios (investor accounts holding that company’s shares). With 46,271 issuers and 33.76 crore folios, this is the most predictable revenue line. It grew 40% YoY, driven by rising IPO listings, unlisted company additions (~2,000/quarter), and organic folio growth. The folio count resets every March 31st, and a heavy IPO year could push the next reset higher.
📌 Transaction Charges (₹60 Cr, 21%): Charged on delivery-based trades settled through CDSL. This is inherently market-linked — when delivery volumes are strong, transaction charges spike. Q3 FY26 was roughly flat YoY at ₹60 Cr (vs ₹59 Cr), reflecting the broader softness in equity market turnover (average daily turnover at BSE+NSE was down 8.3% YoY in December 2025).
📌 IPO & Corporate Action Income (₹59 Cr, 21%): Earned from processing IPO applications, dividend payouts, bonus issues, and other corporate actions. This was volatile — down from ₹62 Cr in Q1 FY26 but up from ₹58 Cr in Q3 FY25. A heavy IPO pipeline supports this line, but it’s inherently lumpy.
📌 Other Income (₹47 Cr, 17%): Includes interest income on the company’s substantial cash and investment portfolio, e-voting fees (₹5.23 Cr in Q3, seasonally weak), eCAS income (₹12.78 Cr), margin pledge income (₹5.42 Cr), and miscellaneous charges. E-voting income is concentrated in Q2 (AGM season) — ₹19.77 Cr was booked in Q2 FY26
.
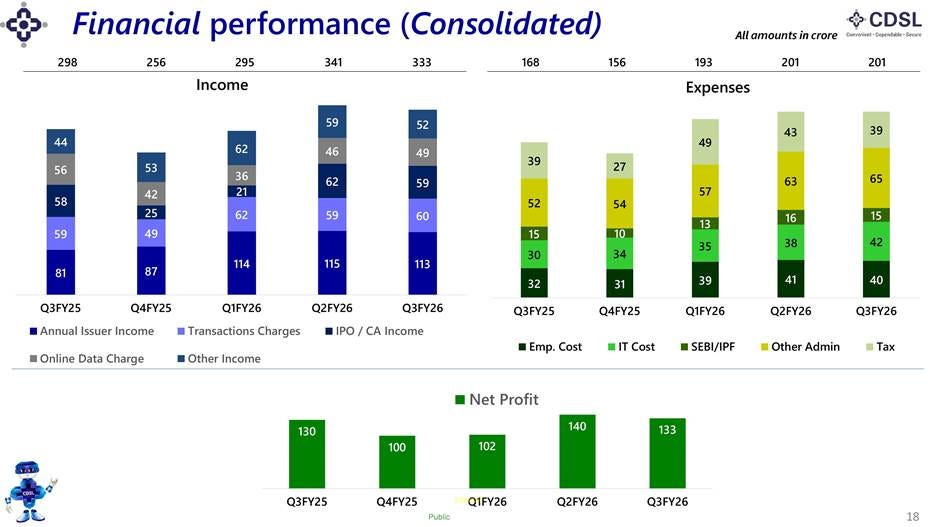
📌 CVL (Subsidiary) — KYC Business: At the consolidated level, CVL adds ~₹45-50 Cr of quarterly revenue through KRA (KYC Registration Agency) services, eKYC, eSign, CKYC processing, and RTA services for ~3,423 companies. However, 9M FY26 revenue from operations fell sharply to ₹132 Cr from ₹189 Cr in 9M FY25 , and PAT collapsed from ₹91 Cr to ₹42 Cr. This is the key drag on consolidated profitability — new demat account openings have slowed (76 lakh in Q3 FY26 vs 92 lakh in Q3 FY25), which directly reduces KYC creation and fetch volumes. The KRA fetch fee of ₹35 per intermediary remains intact for now, but there’s market noise about potential fee rationalisation. Sunil Alvares, CVL’s MD, was clear on the concall: “Regulations are very clear that an intermediary has to fetch for itself. No intermediary can share the KYC record for financial gain.”
Source: CDSL Investor Presentation — Standalone Income, Expenses & Net Profit Breakdown: Quarterly Trend Q3 FY25 to Q3 FY26
WHERE THE MONEY WENT — AND WHERE IT’S GOING
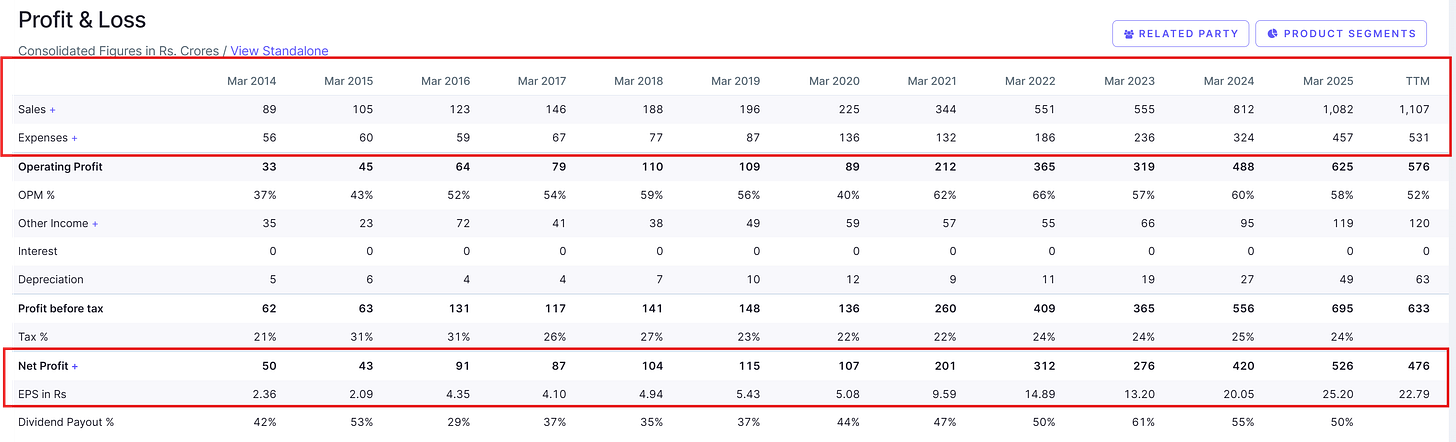
📌 Revenue: FY25 consolidated revenue was ₹1,082 Cr (+33% YoY). 9M FY26 consolidated total income stands at ₹970 Cr vs ₹944 Cr (+2.8% YoY) — the sharp deceleration is largely due to CVL’s revenue decline and slower market activity in H2. Standalone 9M FY26 revenue was ₹881 Cr vs ₹780 Cr (+13% YoY), showing the core depository business continues to grow healthily. If Q4 FY26 mirrors Q3’s standalone run-rate (~₹255 Cr), full-year standalone revenue could touch ~₹1,130-1,150 Cr.
📌 Margins & Costs — The Technology Tension: This is where the concall got most interesting. Standalone EBITDA was ₹168 Cr in Q3 FY26 (66% margin on operating income of ₹255 Cr). But technology costs have surged — from ~7% of revenue in FY23 to 14% now, growing 4x while volumes grew only 1.8x. Q3 FY26 standalone IT cost was ₹33 Cr, employee cost ₹34 Cr, SEBI/IPF charges ₹15 Cr, and other admin ₹43 Cr. Management justified this as capacity building for future surges: “We need to ensure the infrastructure has the latest technology… in sync with AI, security, application upgrades.” An issuer fee hike — pending for 10 years — remains the elephant in the room. Nehal Vora hinted: “The regulator is seeing this. At the appropriate time, the increase will come.”
📌 Balance Sheet: A fortress. Virtually zero debt. Consolidated investments of ₹1,447 Cr as of September 2025, with total assets of ₹2,384 Cr. Cash flow from operations was ₹543 Cr in FY25. The company has maintained a 50-55% dividend payout ratio. ROCE stands at a stellar 42% and ROE at 33%. This is as clean a balance sheet as you’ll find in Indian capital markets.
📌 Earnings Trajectory: Consolidated PAT for FY25 was ₹526 Cr. The 5-year PAT CAGR is 38%, though that base included COVID-affected years. 9M FY26 consolidated PAT is ₹375 Cr vs ₹426 Cr in 9M FY25 — the decline is almost entirely driven by CVL’s profit halving and the absence of one-off dividends. Standalone 9M PAT is ₹399 Cr vs ₹381 Cr (+5%). On a normalised basis, if demat account openings stabilise and market activity recovers, FY27 consolidated PAT of ₹550-600 Cr looks achievable, implying EPS of ₹26-29 on ~20.9 Cr shares.
Source: CDSL Investor Presentation — Consolidated Income, Expenses & Net Profit: Q3 FY26 Consol PAT ₹133 Cr (+2.3% YoY)
IS IT EXPENSIVE OR JUST PRICED FOR PERMANENCE?
The premium is anchored in CDSL’s 80% demat market share, duopoly moat, zero debt, 42% ROCE, and the long structural runway of Indian financialisation.
If we assume FY27E EPS of ~₹28 (15% growth off a normalised FY26 base) and assign a 50x multiple (mild de-rating from today), the math suggests a value of ~₹1,400. At 45x (conservative, reflecting slowing account growth): ~₹1,260. At 55x (bull case — issuer fee hike + market recovery): ~₹1,540. These are not target prices — they are scenario frames. The stock prices in a near-perfect regulatory and market environment, which is both its appeal and its risk.
CONCALL HIGHLIGHTS
On why tech costs keep rising — Nehal Vora: “It’s like building a road. If you have to build from point A to B, that road has to be built. Now how many cars are going, if it’s 5 cars also you have to build the same road, 50 cars also have to build the same road. But as the 50 becomes 500, the quality of the road has to grow. And that cost is significantly higher.”
👉 They view CDSL as an infrastructure utility, not a tech company optimising for margins. The implication: don’t expect technology costs to normalise anytime soon. They’re building for the next surge, not the current quarter.
On the pending issuer fee hike (10 years overdue) — Nehal Vora: “We don’t generally disclose the correspondence we have with the regulator. But I’m sure they are also seeing this… probably at the appropriate time, the increase will come.”
👉 The Chairman is telling you that SEBI is aware of the cost-revenue mismatch. He won’t confirm a timeline, but the phrasing — “at the appropriate time, the increase will come” — is the closest to a forward signal CDSL has given on pricing. If issuer charges are revised even modestly upward, the impact on EBITDA would be immediate and substantial given the annuity nature of this revenue.
On whether KYC fetching could be disrupted by CKYC 2.0 — Sunil Alvares (CVL MD): “KRAs have totally validated data as against that of CKYC. Moreover, the KRAs data has a larger number of fields… There is also a consultation paper from SEBI where they have proposed other details like bank details, occupation, etc., to be held in the KRA. Keeping this development in mind, I feel that the KRAs are here to stay.”
👉 This is CVL’s most assertive defense of its business model. The argument is that KRA data is richer and more validated than CKYC, and SEBI is actually expanding the KRA mandate (adding bank details, occupation). If that consultation paper becomes a circular, it would structurally strengthen CVL’s moat. The risk is the opposite — but for now, regulations clearly protect the intermediary-level fetch model.
On incremental market share slippage to NSDL — Nehal Vora: “The incremental market share has dropped based on certain seasonal circumstances if some DP is facing slower growth in 1 or 2 months. But overall, if you see the numbers is ranging in that same range. There has been no significant drop as I would see it as of now.”
👉 The analyst (Sanketh Godha from Avendus Spark) pushed hard on this, noting that incremental share has dipped even though outstanding share remains dominant. Vora’s answer is measured but not dismissive — he acknowledges the dip but attributes it to DP-level seasonality, not structural migration. The real tell is his emphasis on “value proposition from a technology standpoint, from a service standpoint” — suggesting CDSL is aware it needs to earn its 80% share every quarter.
On disclosing fixed vs. variable technology costs — Nehal Vora (when an analyst from Helios Capital asked for more granularity): “It is tough for us to put it out what is firm fixed and what is firm variable because there are lines which go beyond fixed and variable also. So hence, we are not putting out. It’s not that we don’t want to put it out.”
👉 This was the most frustrating exchange for analysts — and understandably so. Technology costs have gone from 7% to 14% of revenue in three years, yet management won’t disclose how much is maintenance vs. investment. For a company trading at high valuation, this opacity is a legitimate concern. If you’re modelling CDSL’s operating leverage, you’re essentially guessing on the cost structure — and management isn’t helping.
KEY RISKS
⚠️ Slowing demat account growth: New account openings have decelerated from 92 lakh/quarter (Q3 FY25) to 76 lakh (Q3 FY26). Industry demat growth in CY2025 was 16.5%, the lowest in six years. The easy post-COVID growth phase may be behind us, directly impacting KYC revenue and long-term issuer charge growth.
⚠️ CVL’s revenue collapse: CVL’s 9M revenue fell 30% YoY and PAT halved. If regulatory changes to KYC fetching rules or fee caps materialise, this high-margin subsidiary could see further erosion. The KRA business is under scrutiny amid talks of CKYC 2.0 integration.
⚠️ Technology cost inflation: IT costs have gone from 7% to 14% of revenue with no clear visibility on a ceiling. Management refused to provide fixed/variable cost breakdowns, making it difficult to model operating leverage. If costs continue scaling faster than revenue, margin compression is inevitable.
⚠️ Regulatory pricing risk: CDSL’s fees are ultimately set with SEBI oversight. An issuer fee hike has been pending for 10 years — but conversely, SEBI could also reduce transaction charges or KYC fees to lower market participation costs. The company has no pricing power independent of the regulator.
⚠️ NSDL’s incremental share gains: While CDSL dominates on outstanding accounts, NSDL has been gaining incremental market share in recent months. Management downplayed this as “seasonal”, but if large DPs begin dual-depository strategies, CDSL’s 80% dominance could gradually erode.
THE VERDICT
CDSL is one of the cleanest infrastructure businesses in Indian capital markets — a regulated duopoly with 80% market share, zero debt, 42% ROCE, and a direct bet on India’s financialisation wave. The standalone depository business continues to compound steadily, driven by annuity-like issuer charges and steady transaction volumes. But the consolidated picture is muddier: CVL’s sharp revenue decline, rising technology costs with limited disclosure, and decelerating new account growth create a near-term earnings headwind that the current multiple doesn’t fully reflect. I’ll be watching Q4 FY26 new account openings and the CVL revenue trajectory more closely than any headline number. The long-term thesis remains intact — but the price demands near-perfect execution.
Disclaimer — This article is for information purposes only and should not be considered investment advice or a recommendation to buy or sell any security. Please conduct your own research or consult a qualified financial advisor before making any investment decision. Reco Wealth is a SEBI-registered Research Analyst.